(CASE 03 · SELF-INITIATED · 7 DAYS)
Seven days from nothing to four platforms.
FlowLift is a B2B SaaS activation layer designed end to end in seven days, with me directing AI workflows: research, strategy, a design system, and roughly 60 screens across desktop, tablet, mobile web and native iOS.
STATED FIRST
FlowLift has no users. The customer in every screen, InvoicePilot, is invented, and its data is a single hand-reconciled dataset, not a live feed. Nothing here is validated by behaviour, what this case proves is decision quality and delivery.
- ROLE
- Designer, directing AI workflows
- CLIENT
- Self-initiated
- TIMELINE
- Seven days, 2026
- BASIS
- No users, invented data
~60 SCREENS · 4 PLATFORMS · 7 DAYS · 1 DESIGN SYSTEM
The first thesis didn’t survive research.
The week began with an adversarial pass on my own idea. The starting thesis, an all-in-one Conversion OS, went to research agents whose job was to break it, and it broke: too big to trust, and competing with the stack a buyer already runs. What survived was smaller and sharper: an activation layer on top of the analytics you already have. Keep your stack, we tell you what to fix.
No screen existed before the system.
Tokens first, then atoms with every state designed, buttons through avatars, each with default, hover, focus, pressed, disabled, error, empty and loading, then molecules, then screens assembled only from approved parts. The tempting shortcut, per-platform components, was killed on day one: faster for the first twenty screens, unmaintainable by the sixtieth. When a component changed, sixty screens changed with it.
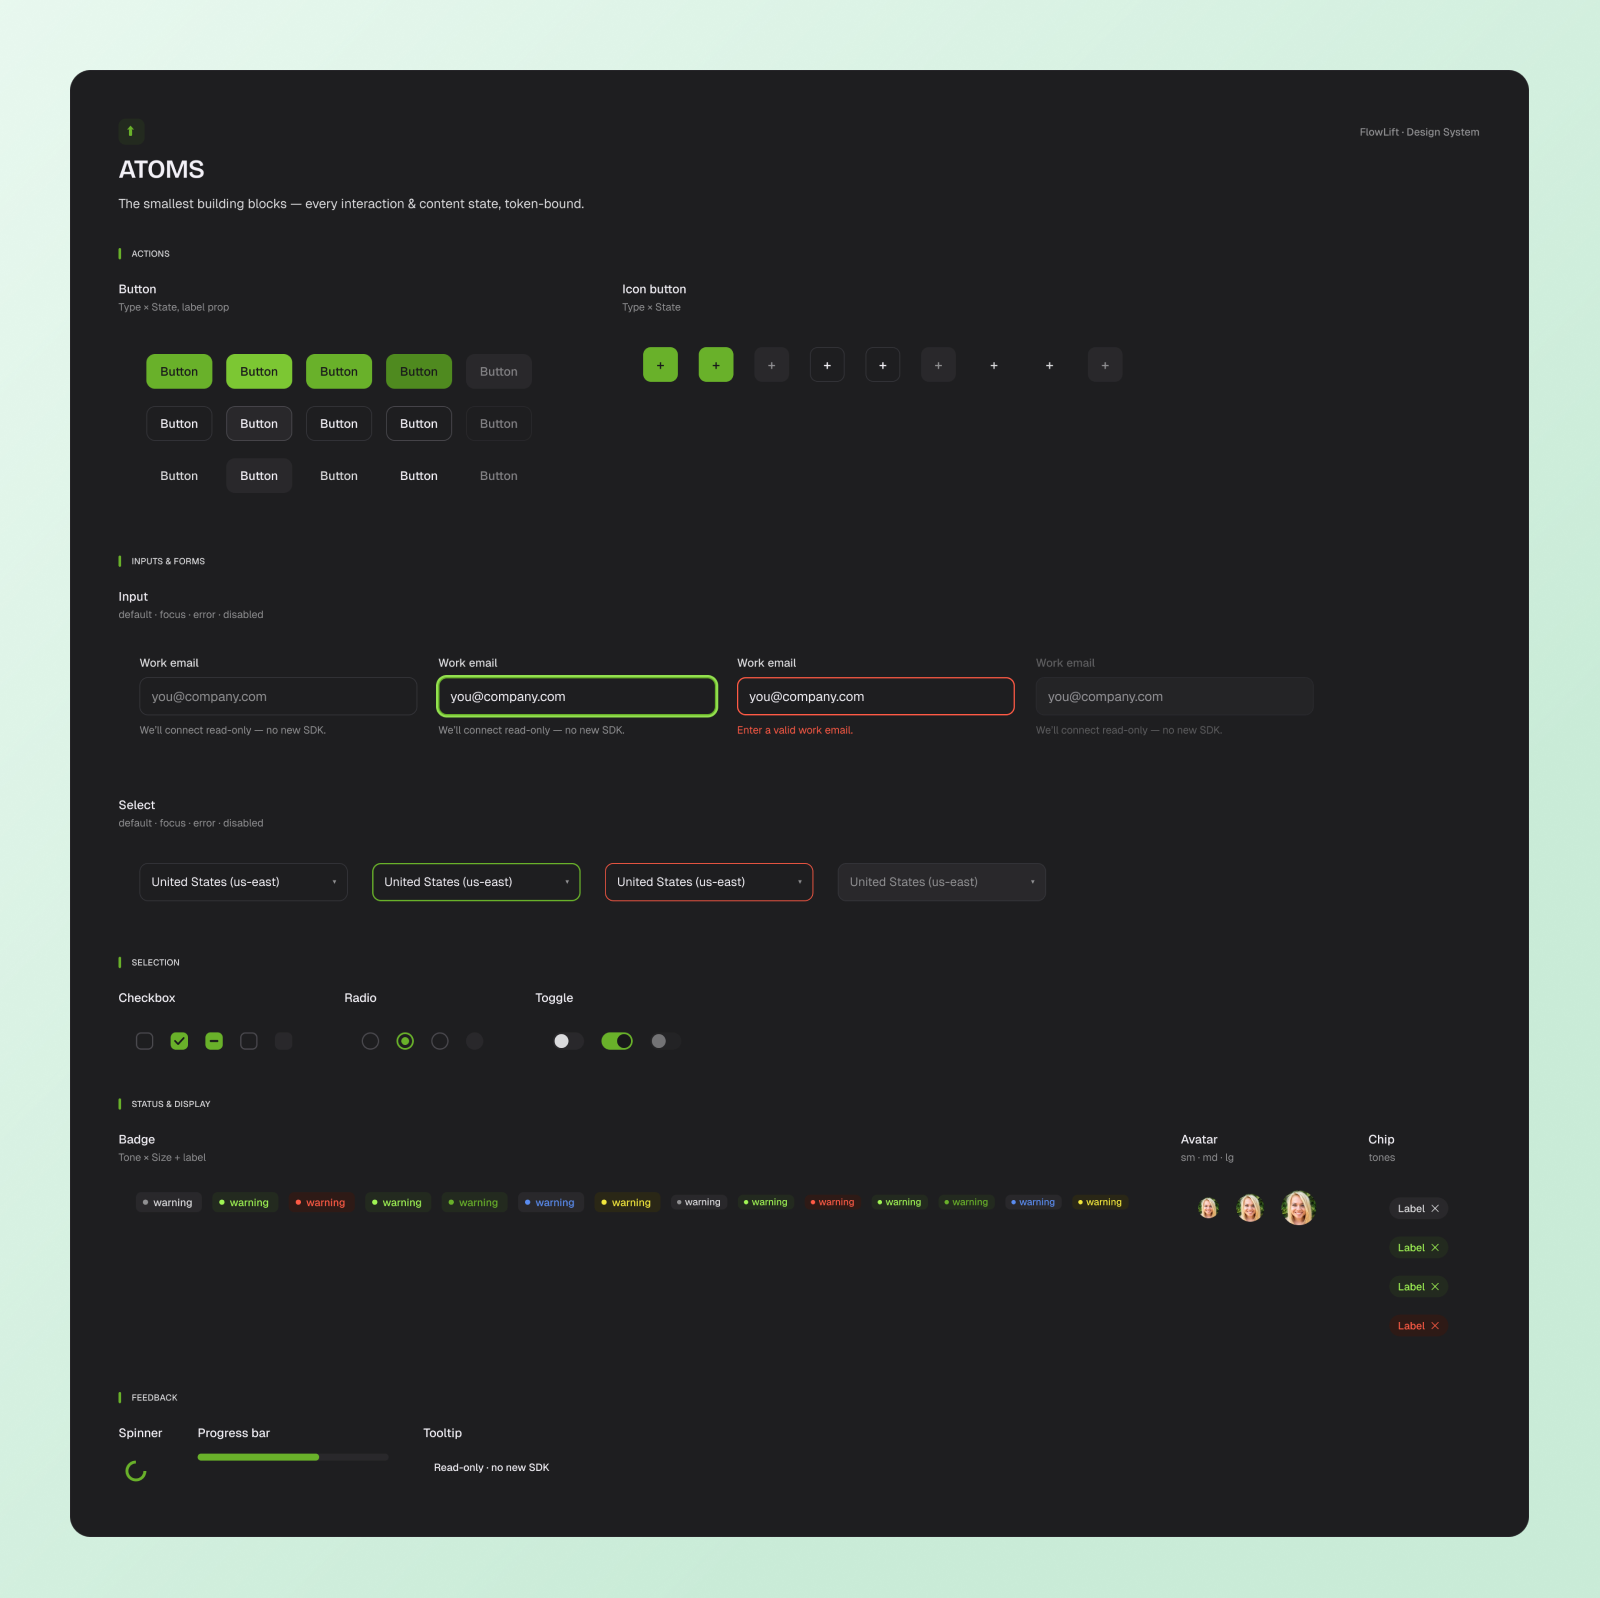
FIG. 03 · THE ATOMS — EVERY STATE, TOKEN-BOUND, BEFORE A SINGLE SCREEN
Leaks, ranked by what they cost.
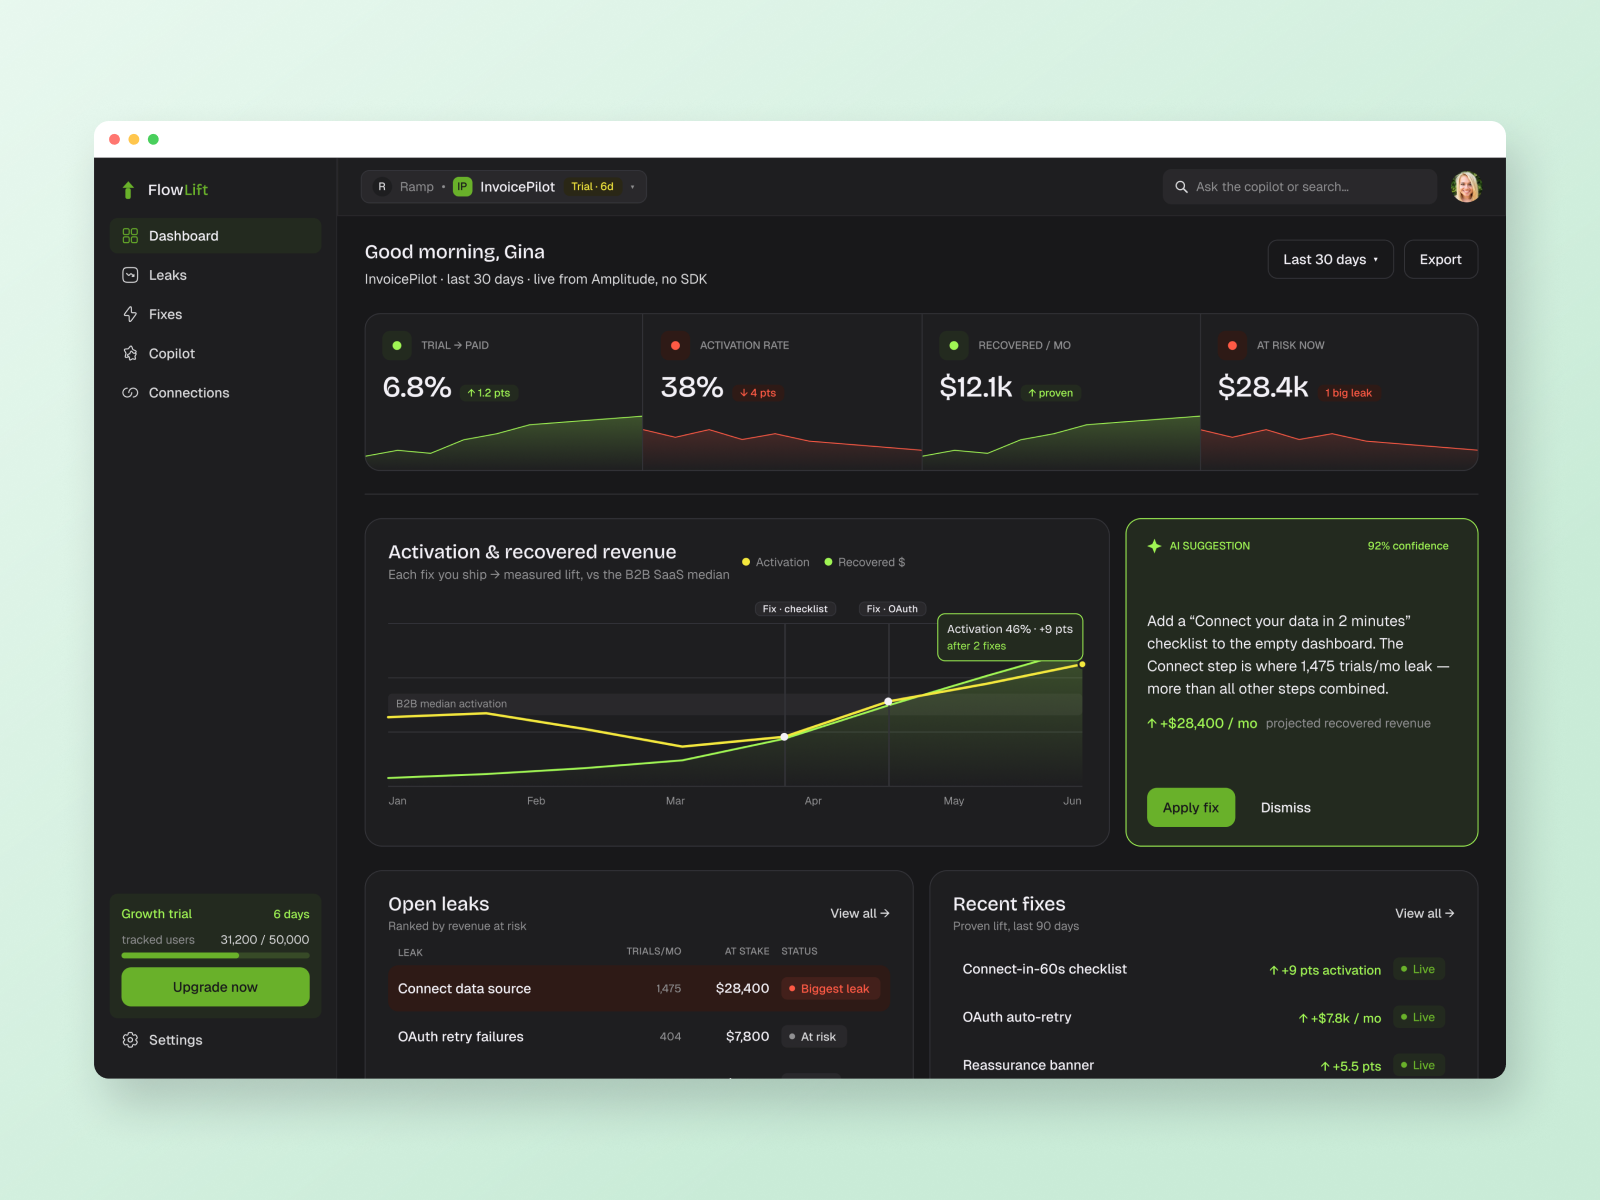
The dashboard ranks trial-funnel leaks in dollars, rendered on InvoicePilot, the invented customer whose one hand-reconciled dataset sits behind every screen. The product’s signature came from a rejection: the first funnel visual was a generic bar chart, and I killed it for a custom activation-path diagram, green for trials that connected, coral for the ones that leaked. And every AI suggestion in the product carries Apply and Dismiss, a number-backed rationale and an audit trail, because an assistant that cannot show its work cannot be trusted with revenue.
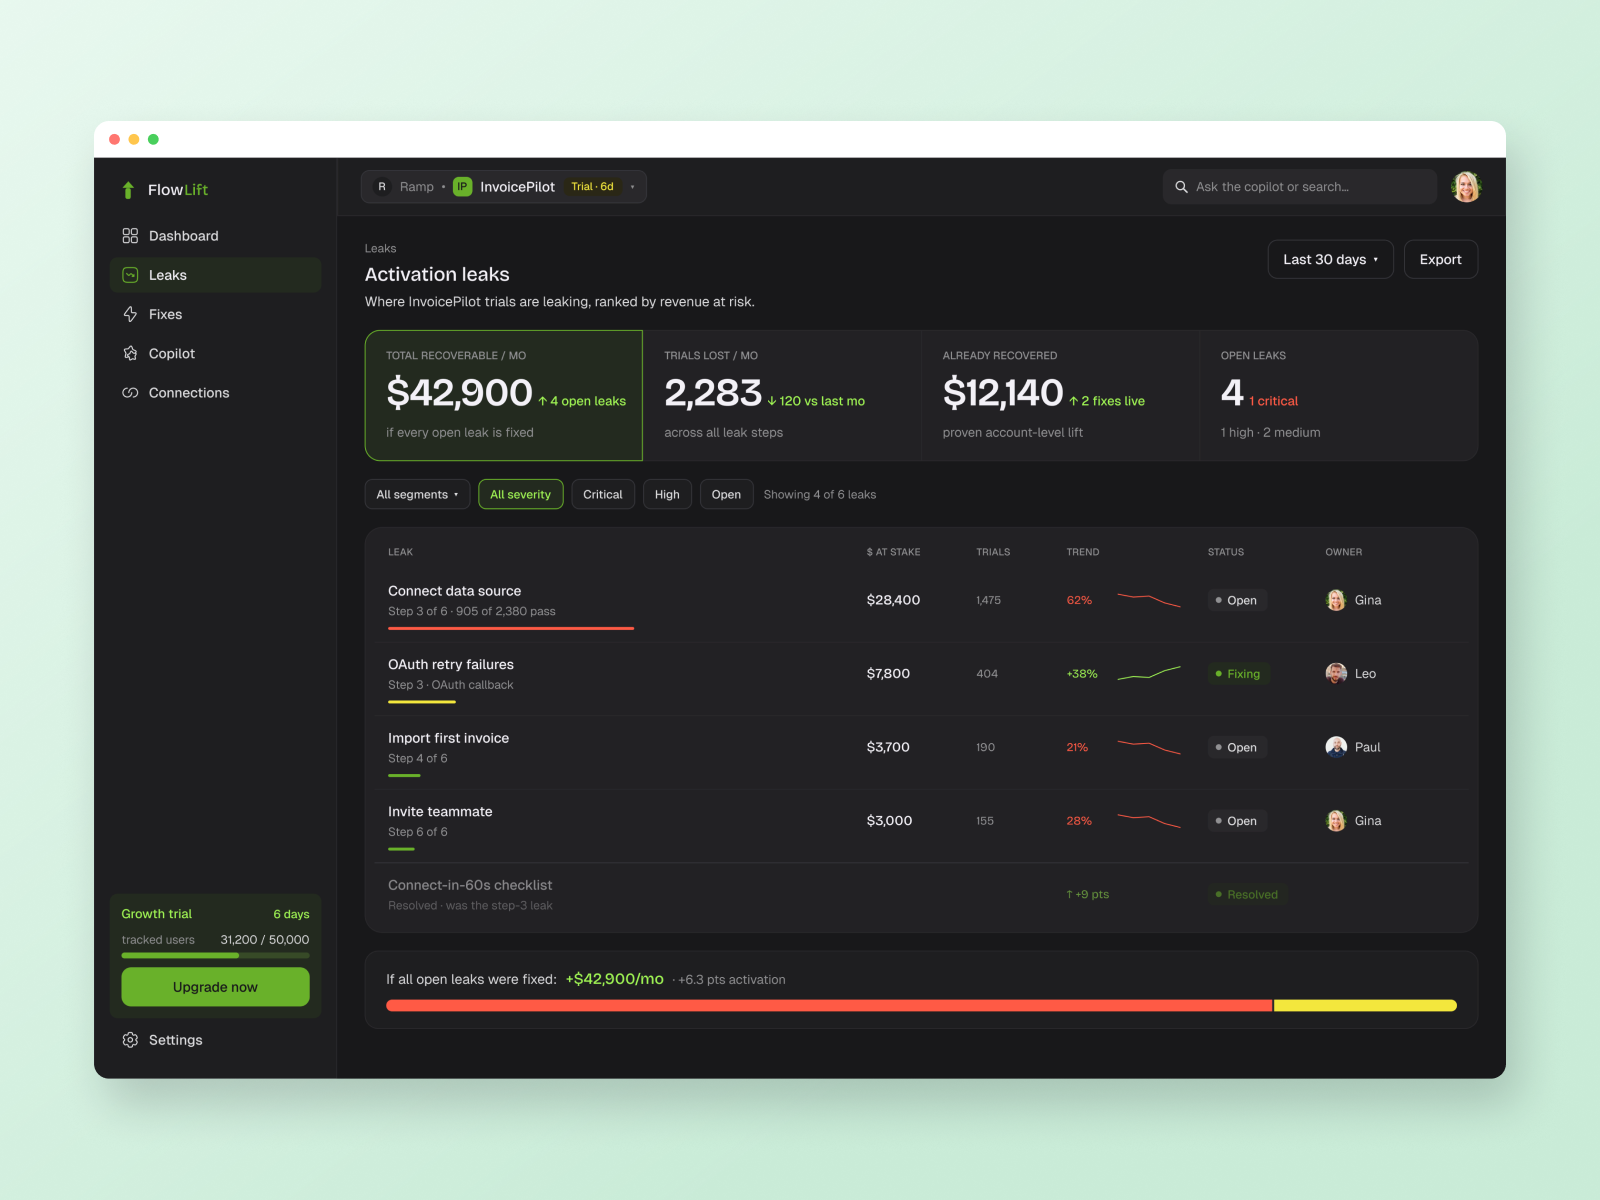
FIG. 04 · THE LEAK RANKING
Every leak is a row with a dollar figure and an owner. The interface argues in money because that is the language a buyer already trusts.
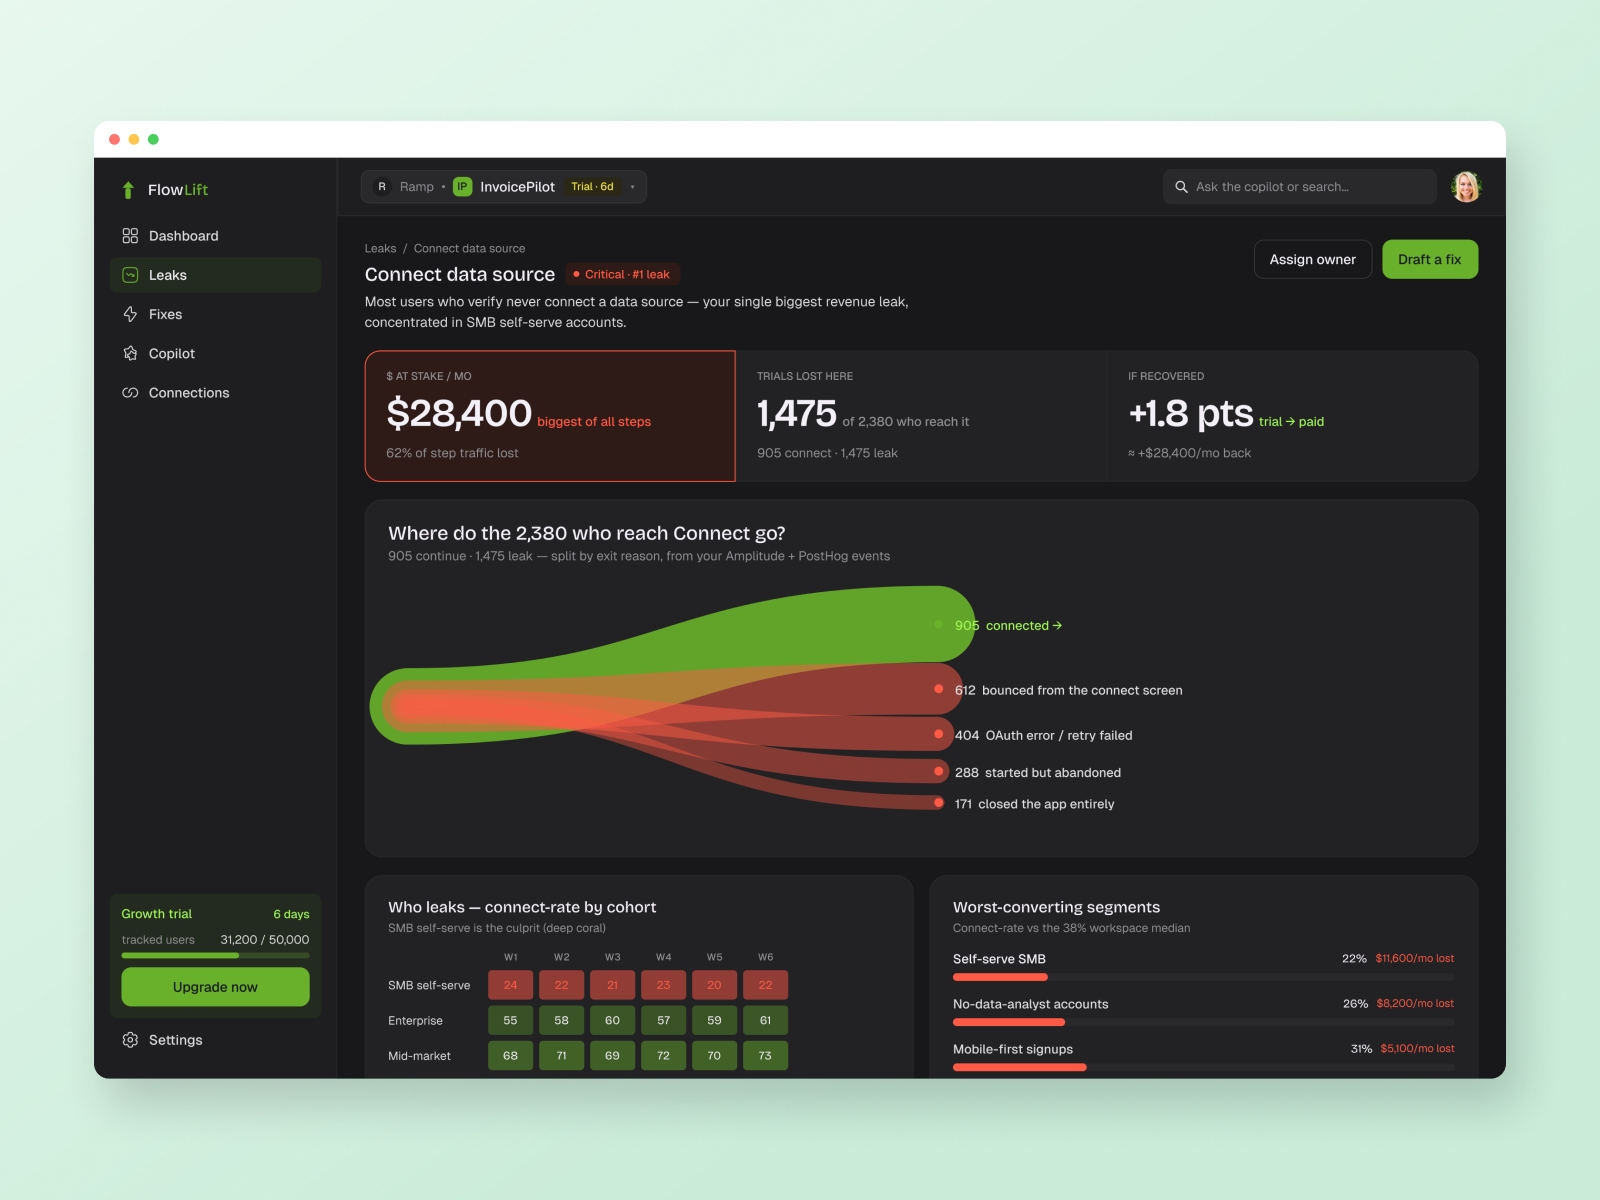
FIG. 05 · LEAK DETAIL
The activation-path diagram that replaced the bar chart: green for connected trials, coral for the leak, a cohort heatmap underneath.
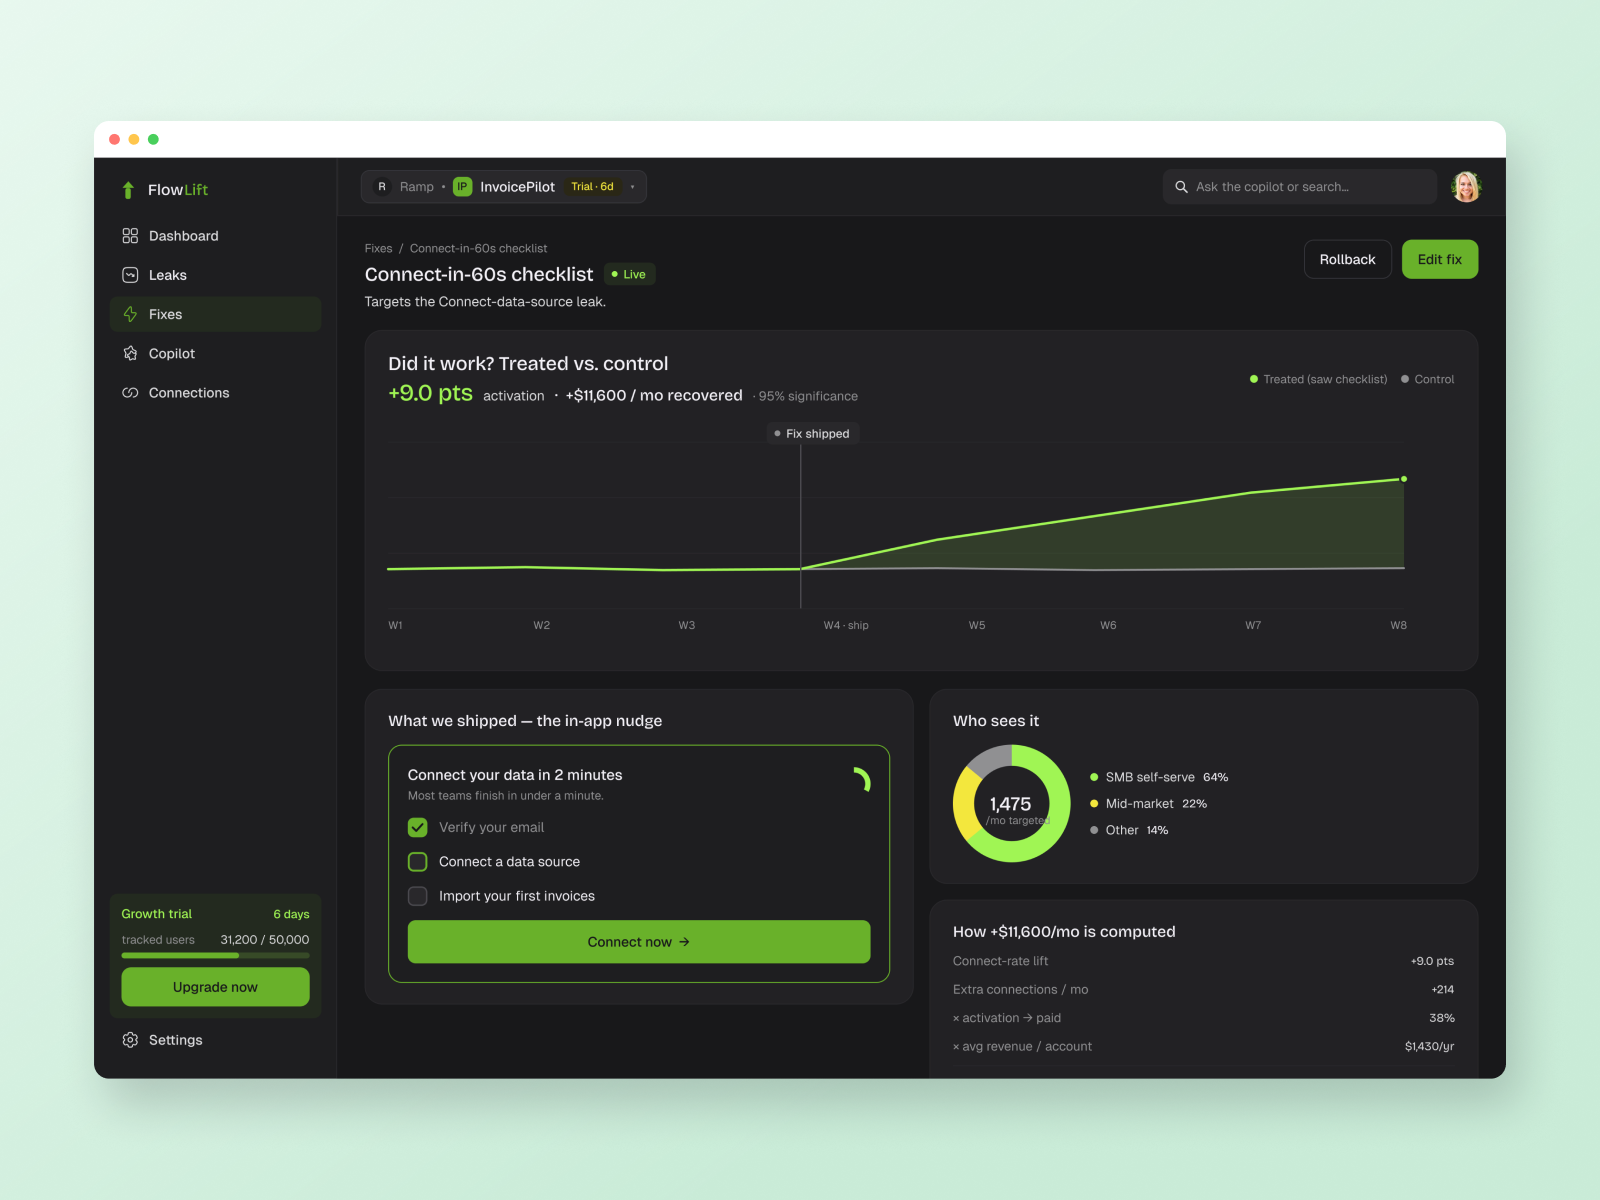
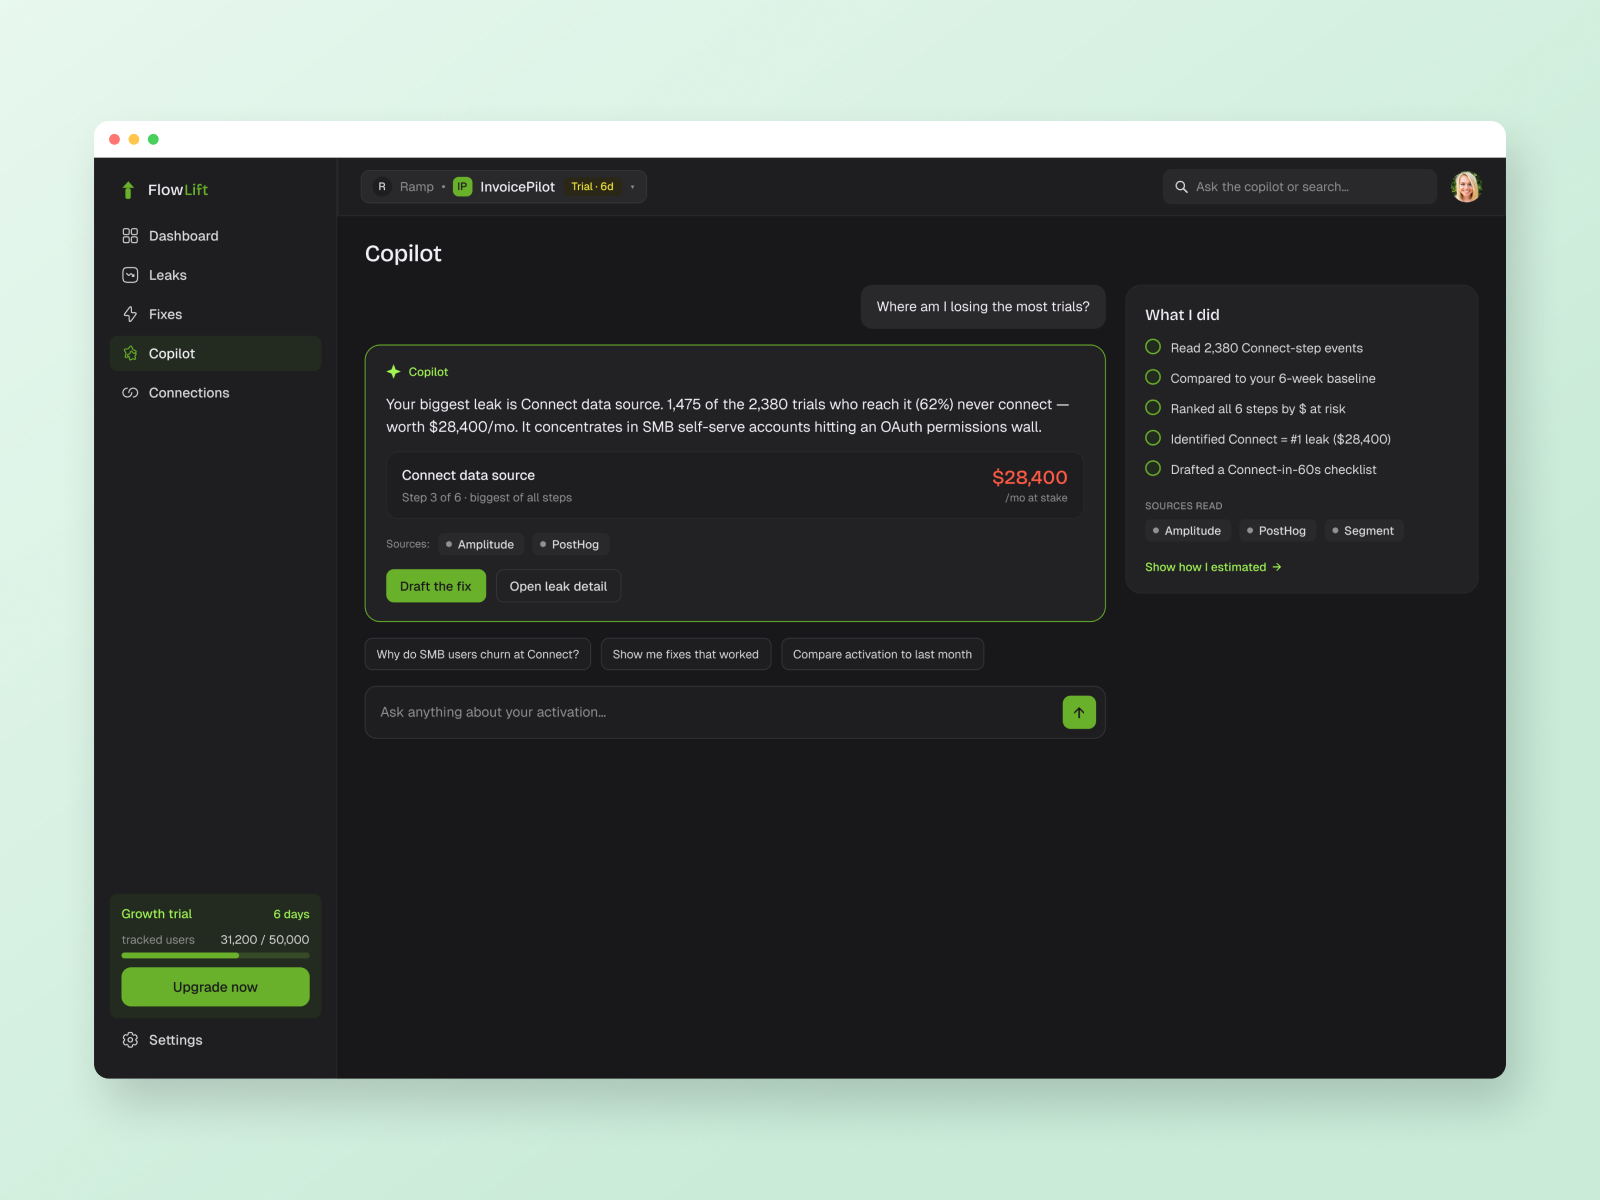
FIG. 06 · PROOF AND COPILOT — TREATED VS CONTROL, AND AN ASSISTANT THAT SHOWS ITS SOURCES
One grammar survived four platforms.
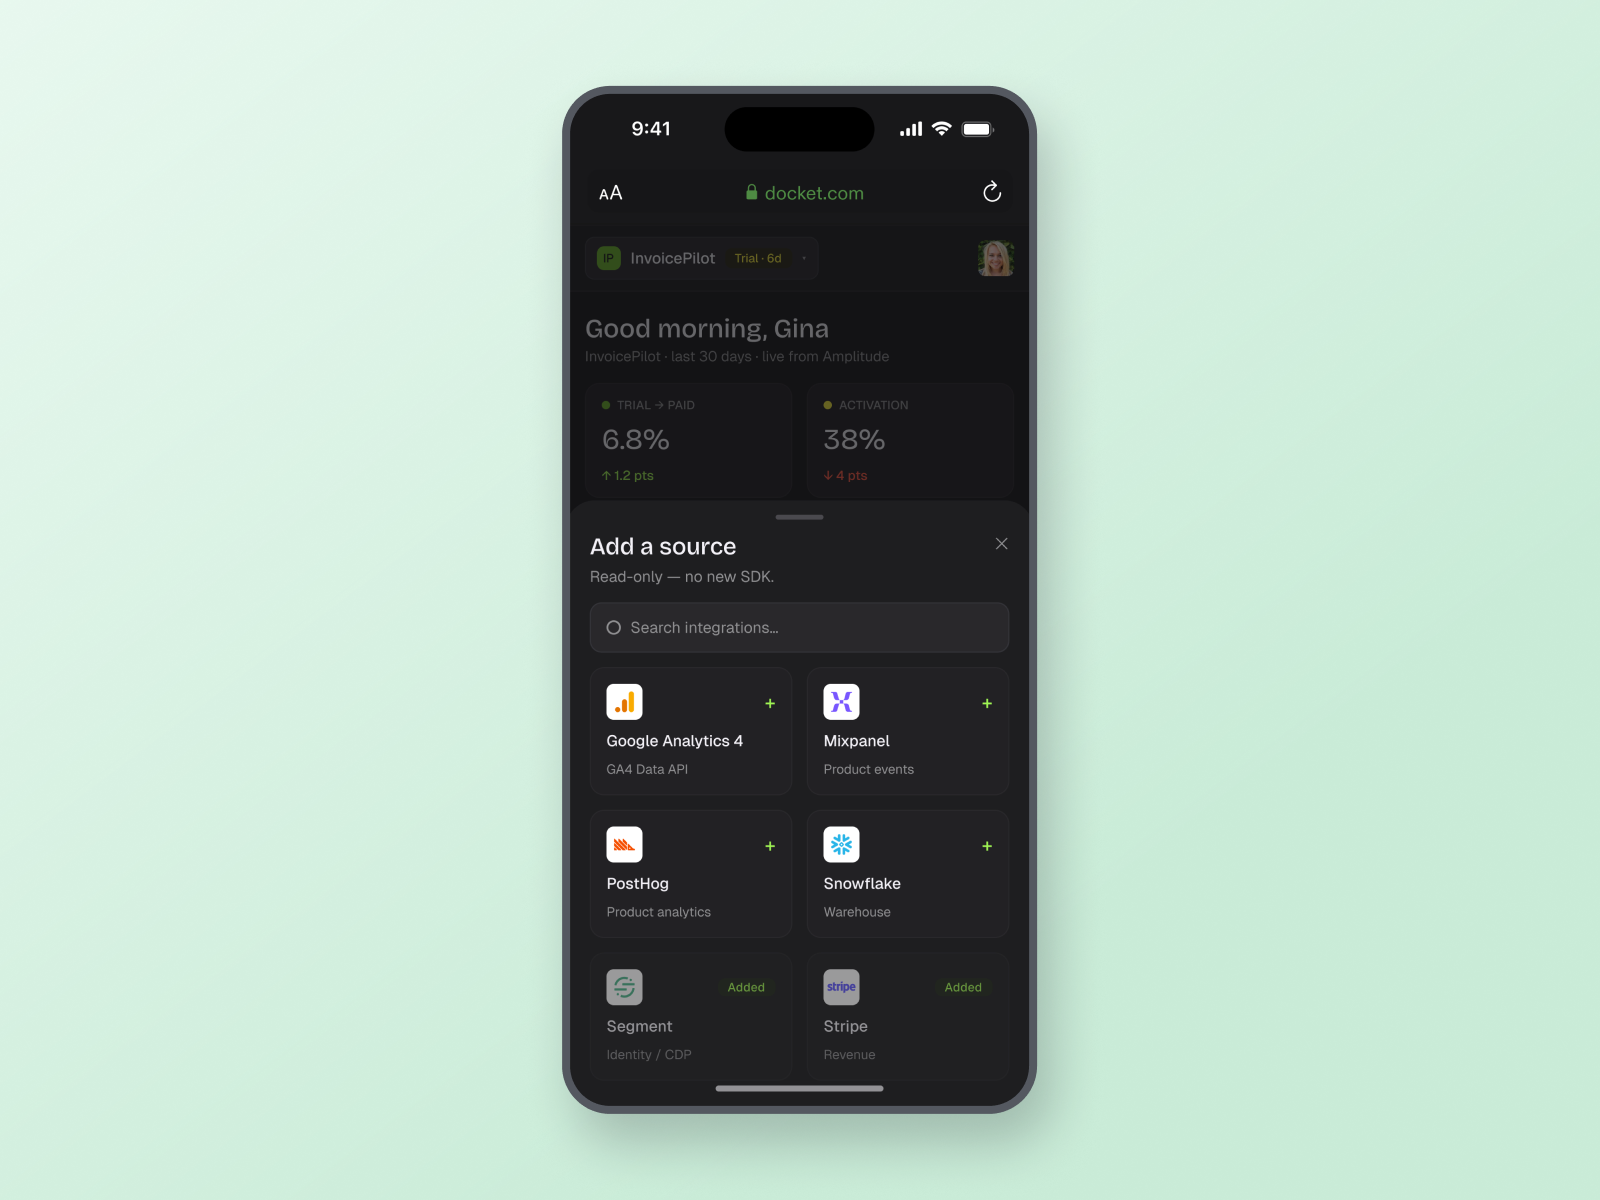
Desktop, tablet, mobile web and native iOS, including a lock-screen live activity and a home-screen widget, all reflowed from the same tokens and the same data hierarchy. Which platform was allowed to be ugly was decided on day one, before a single screen could argue about it.
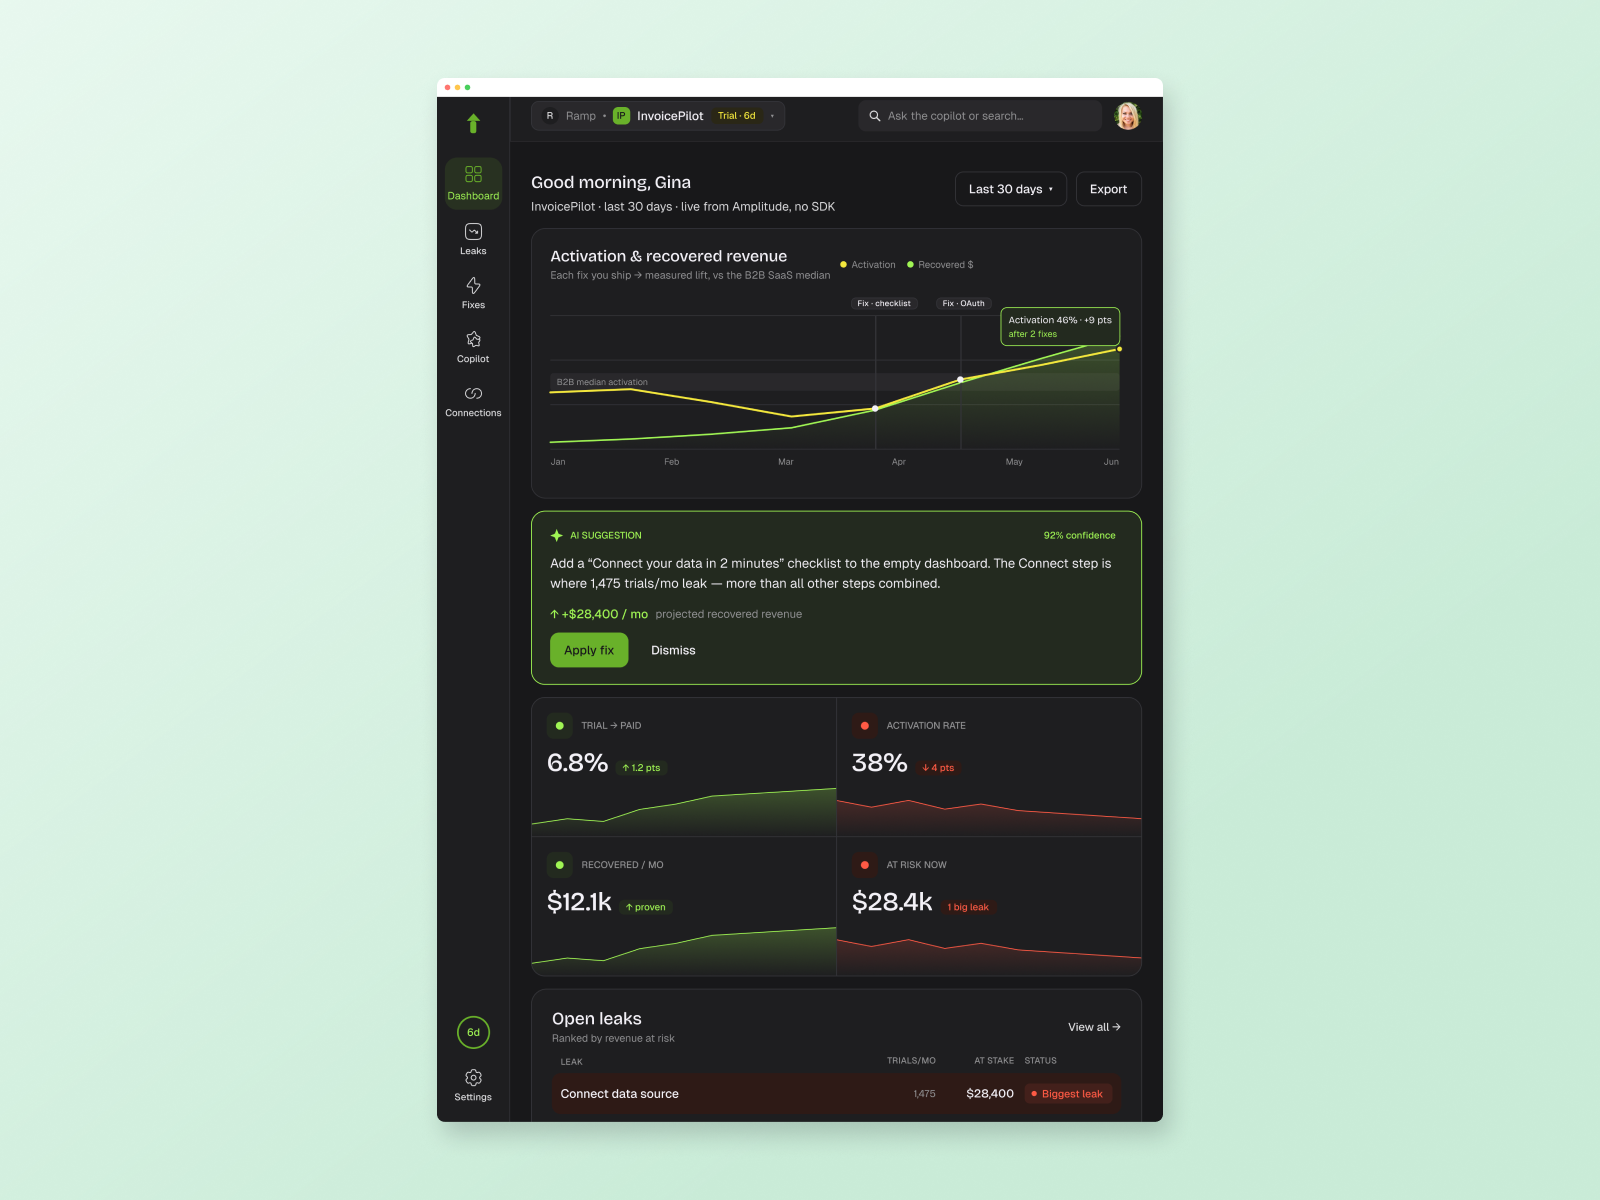
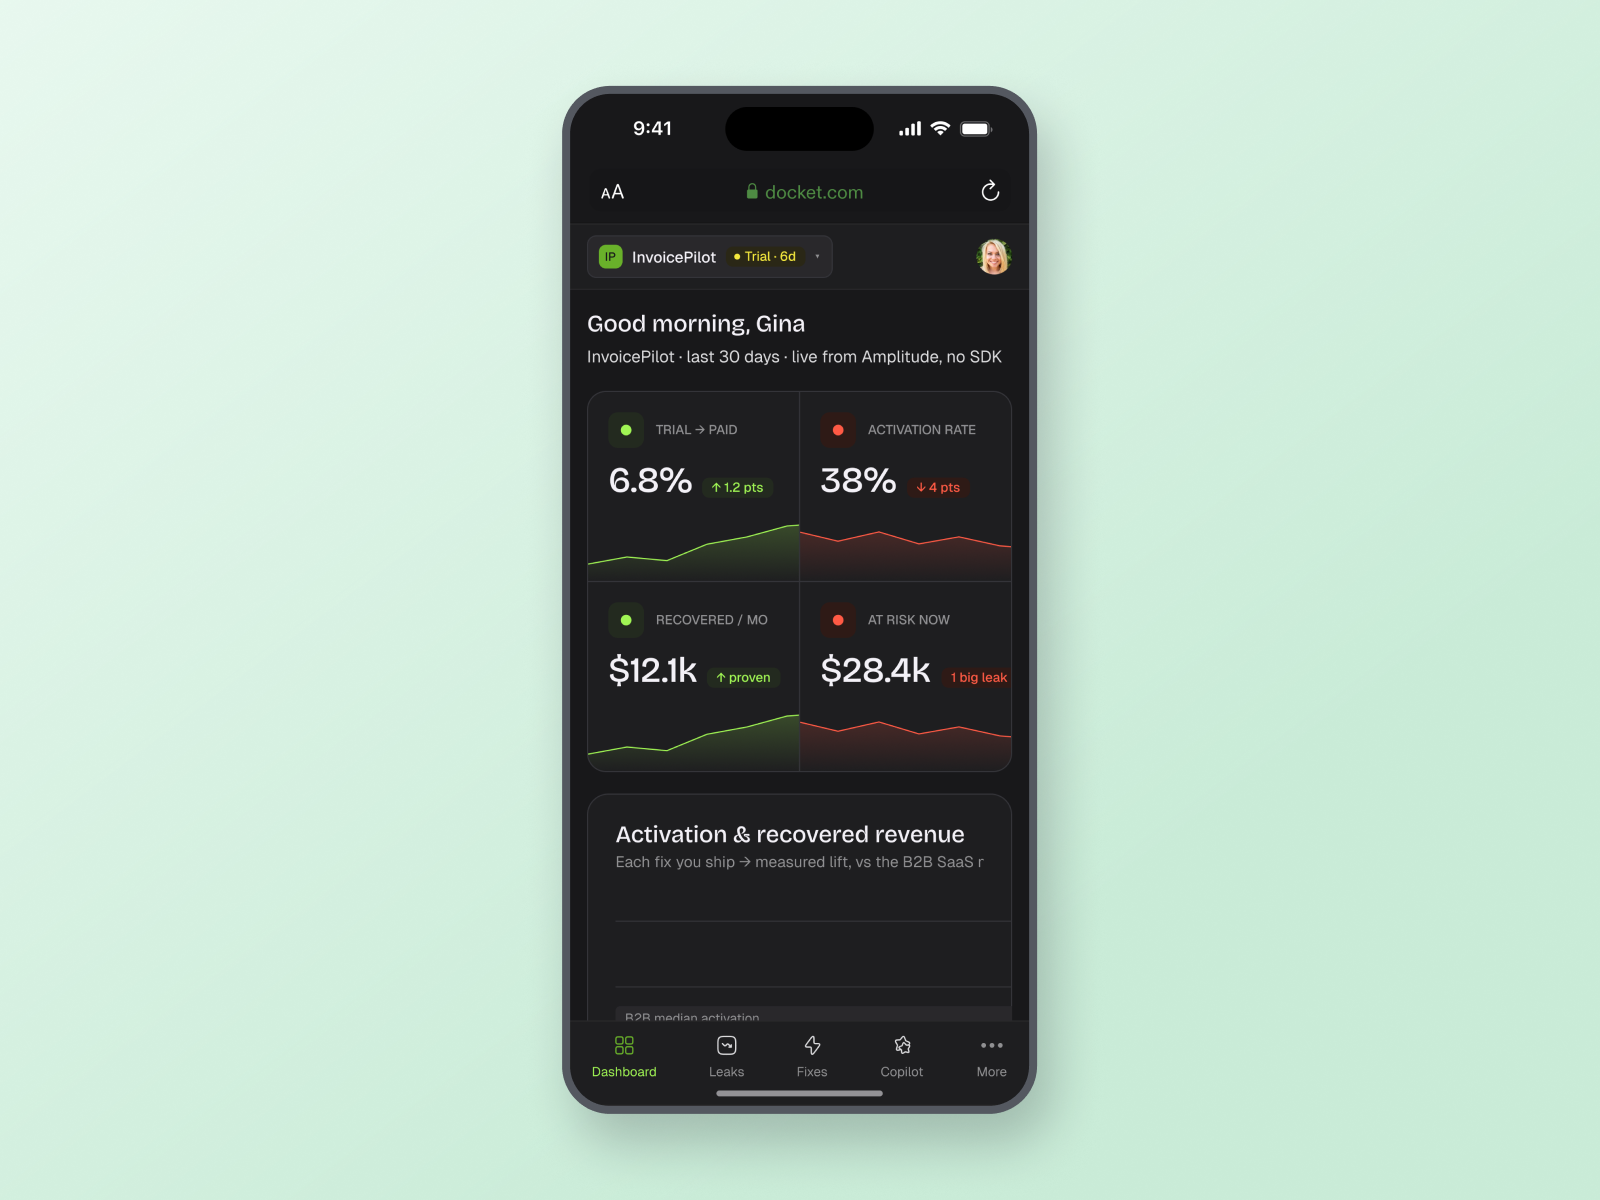
FIG. 07 · TABLET AND MOBILE — ONE GRAMMAR AT EVERY WIDTH
The pitch is the product’s own words.
The surviving thesis became the homepage, almost word for word: keep your stack, we tell you what to fix. The marketing site is drawn from the same tokens and components as the product, and the numbers on it are InvoicePilot’s, labelled invented like everything else. One system draws the product and the pitch.
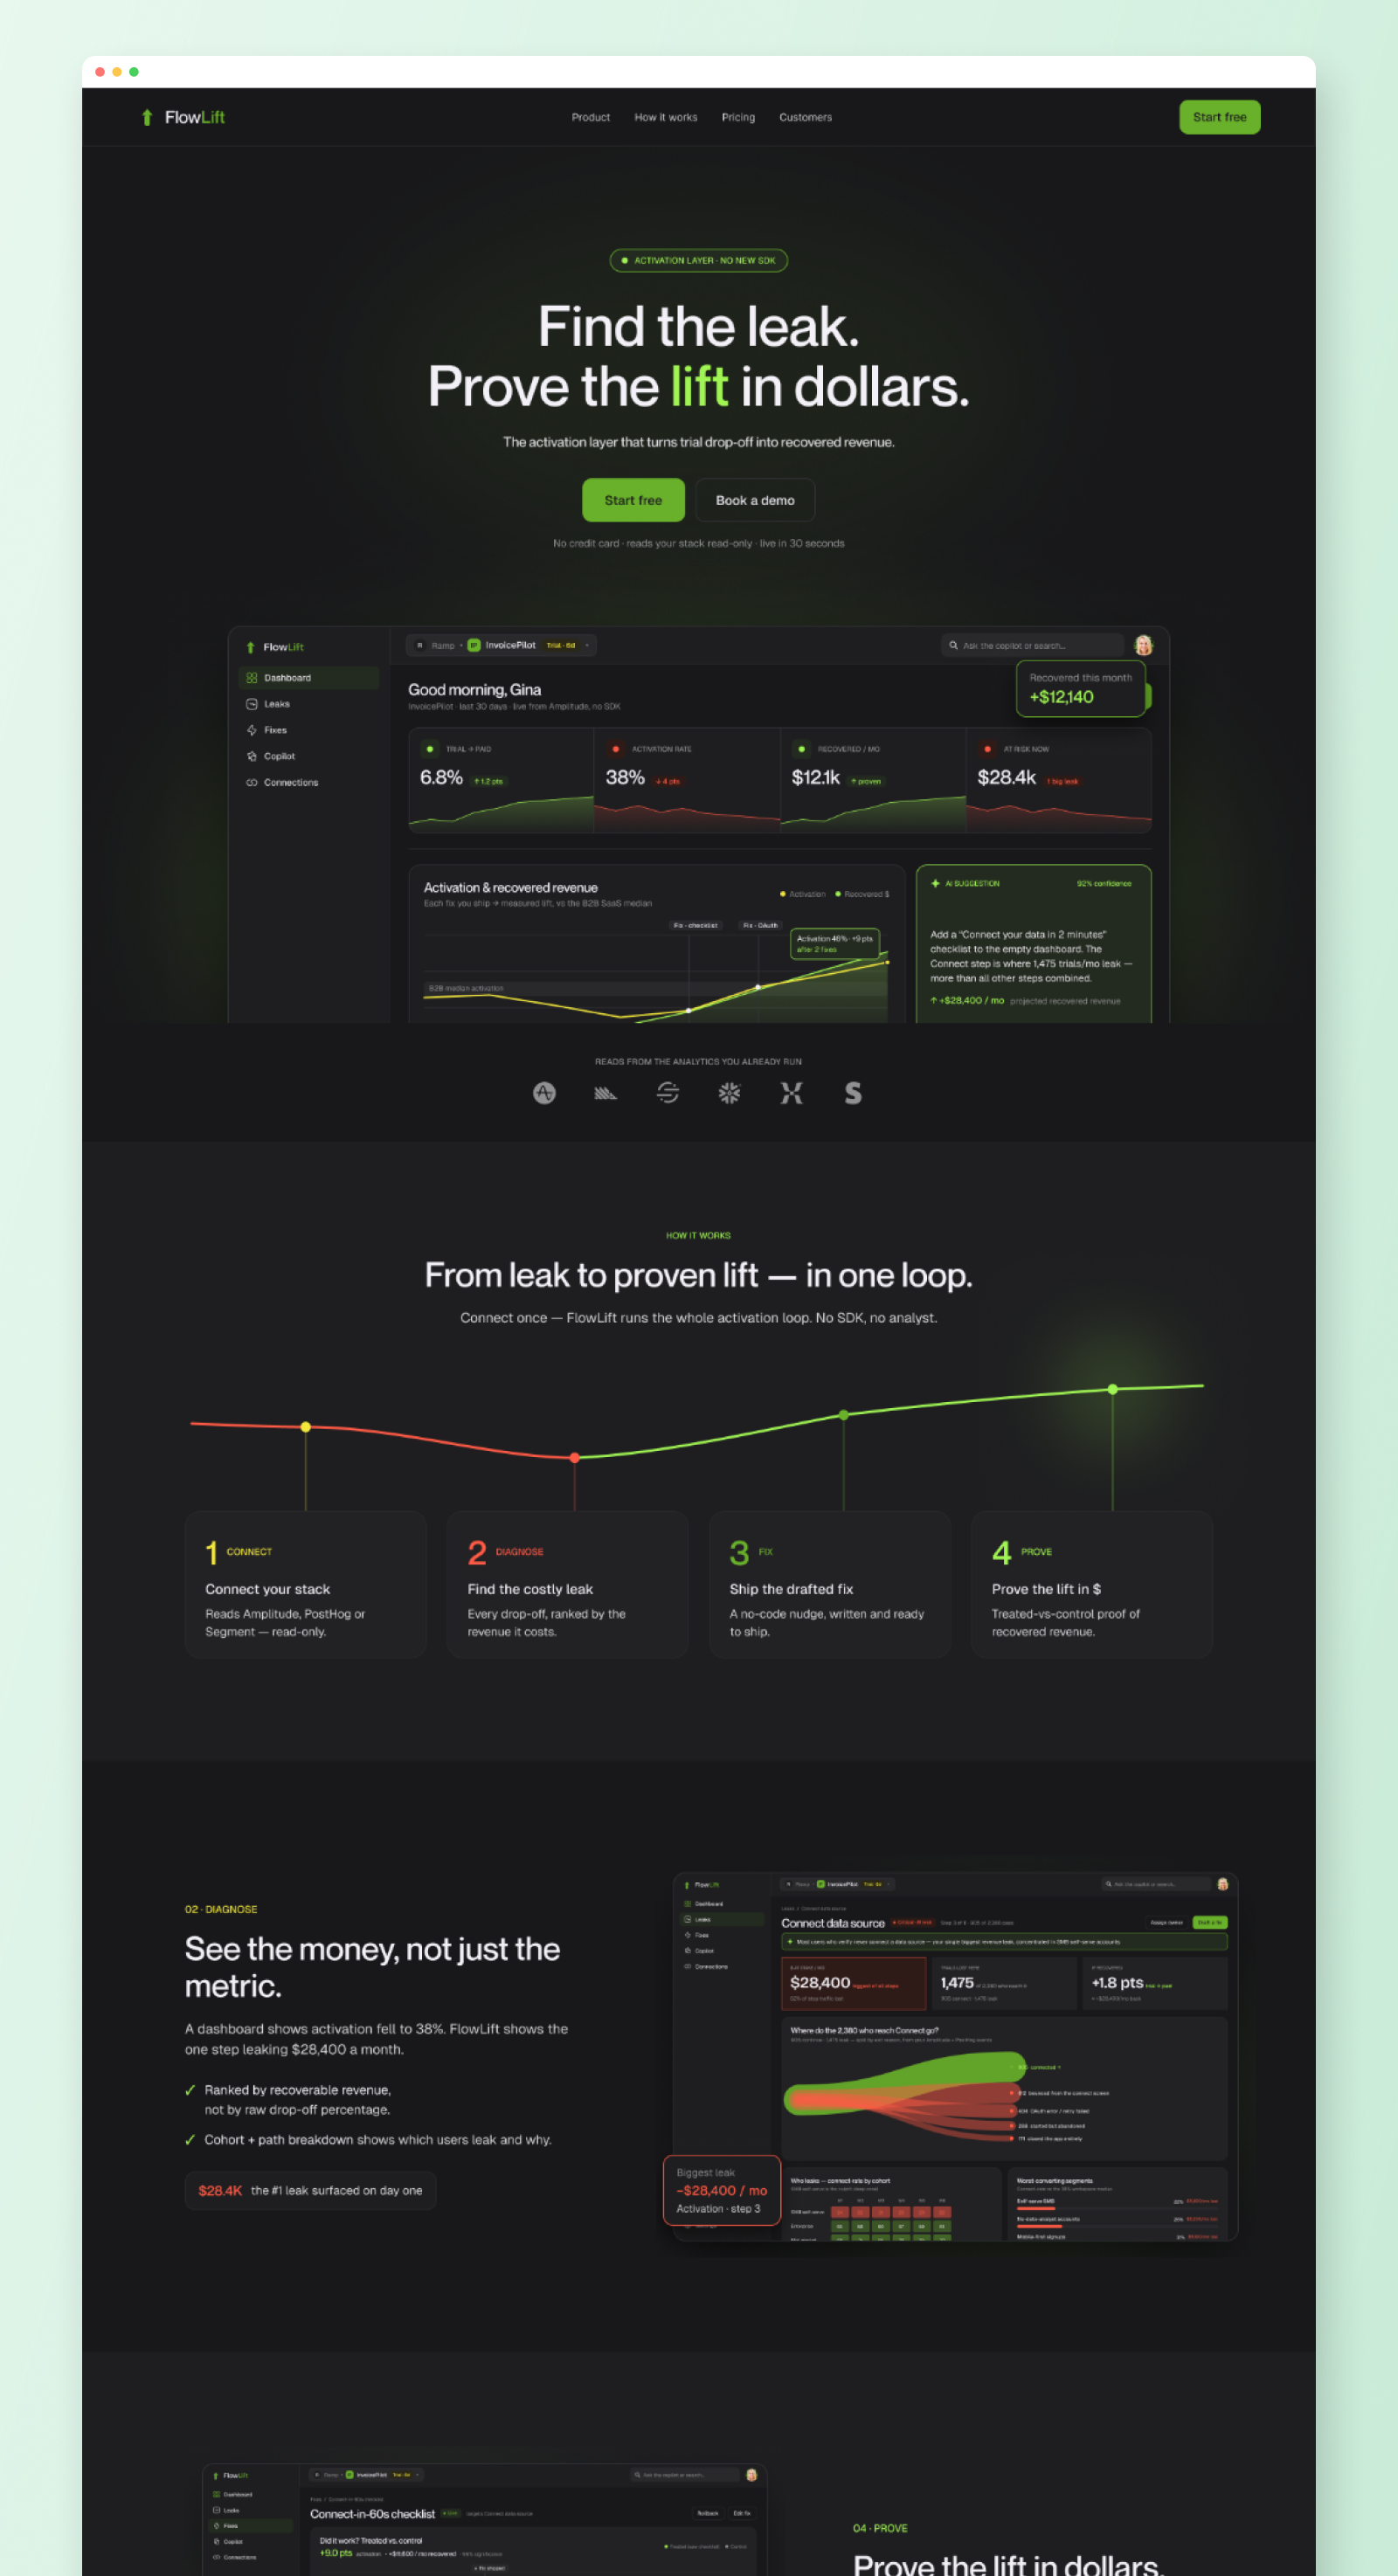
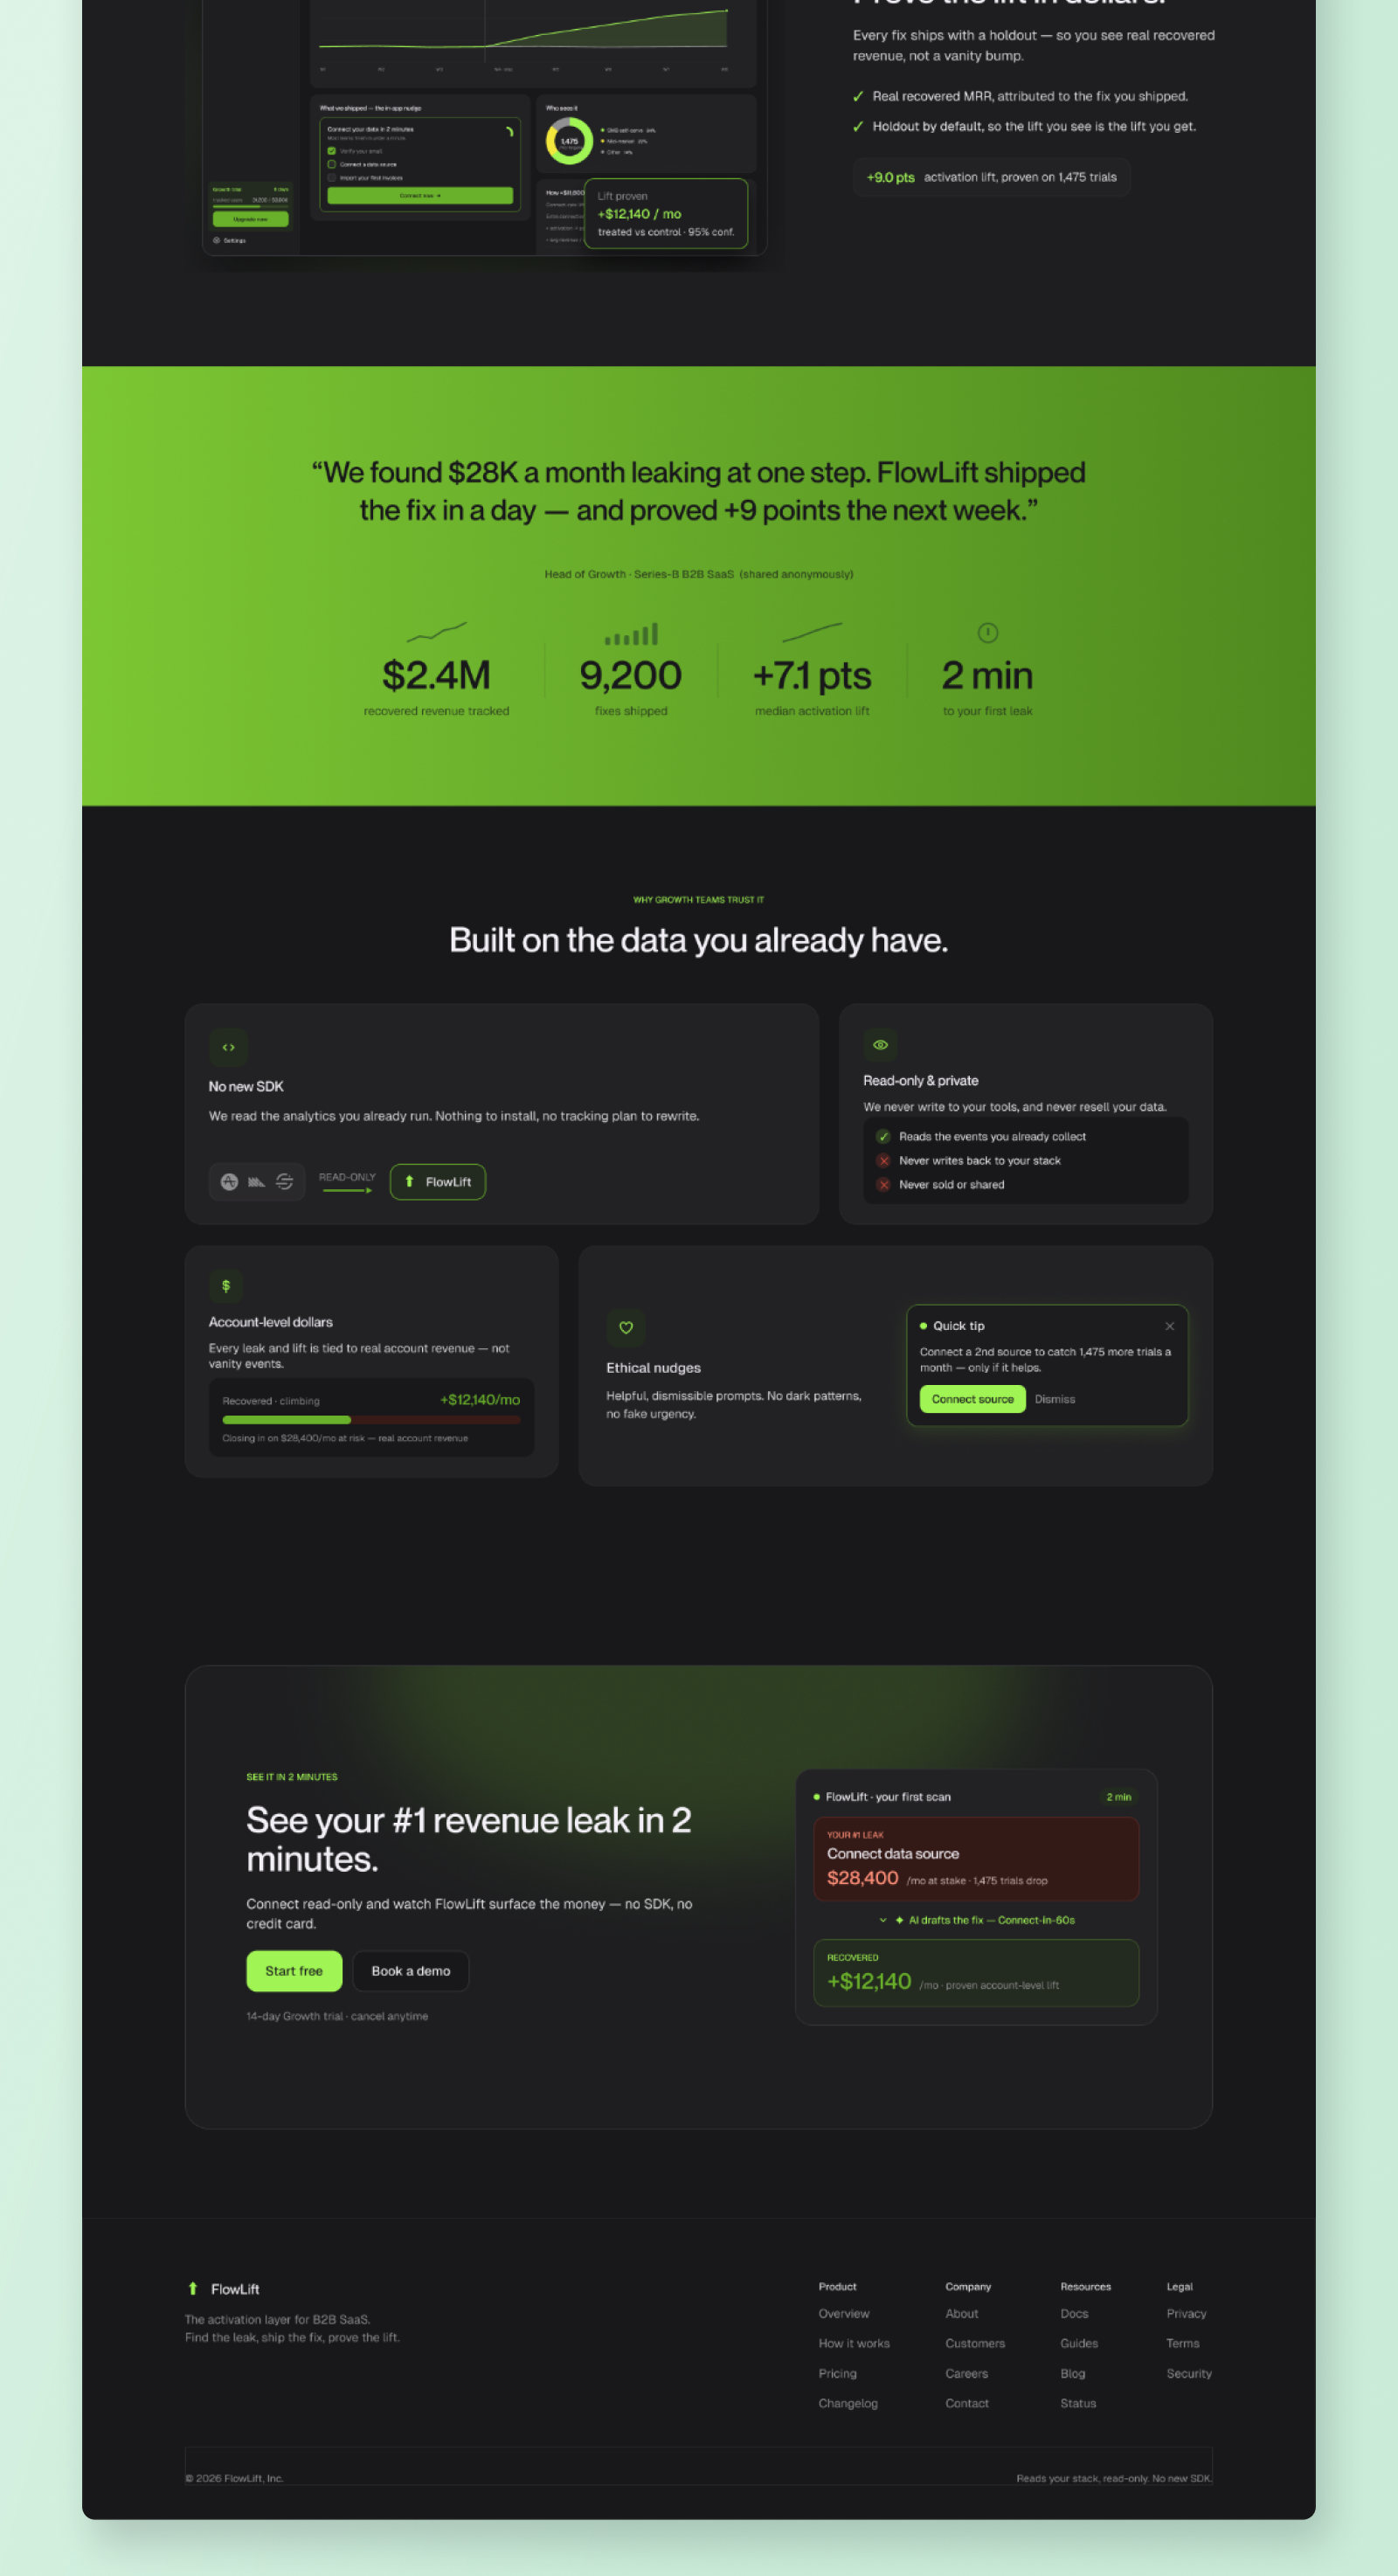
FIG. 08 · THE MARKETING SITE, IN FULL — SCROLL THE FRAME
The AI was fast and frequently wrong.
The week was me directing it. I set the bar, originated the strategy, caught the misses and made every accept or reject call, and reviewer agents audited the builder agents before anything reached me. The split was deliberate: judgment stayed mine, and the volume work went to the workflows. When the production cost of a screen falls to near zero, the value moves entirely to the decisions.
JUDGMENT · MINE
- Positioning and product strategy
- Information architecture
- Brand, colour and type direction
- The senior quality bar
- Every accept or reject decision
VOLUME · THE WORKFLOWS
- Multi-agent research and synthesis
- Option generation at speed
- Building the screens in Figma
- Token and component sweeps
- Adversarial QA passes
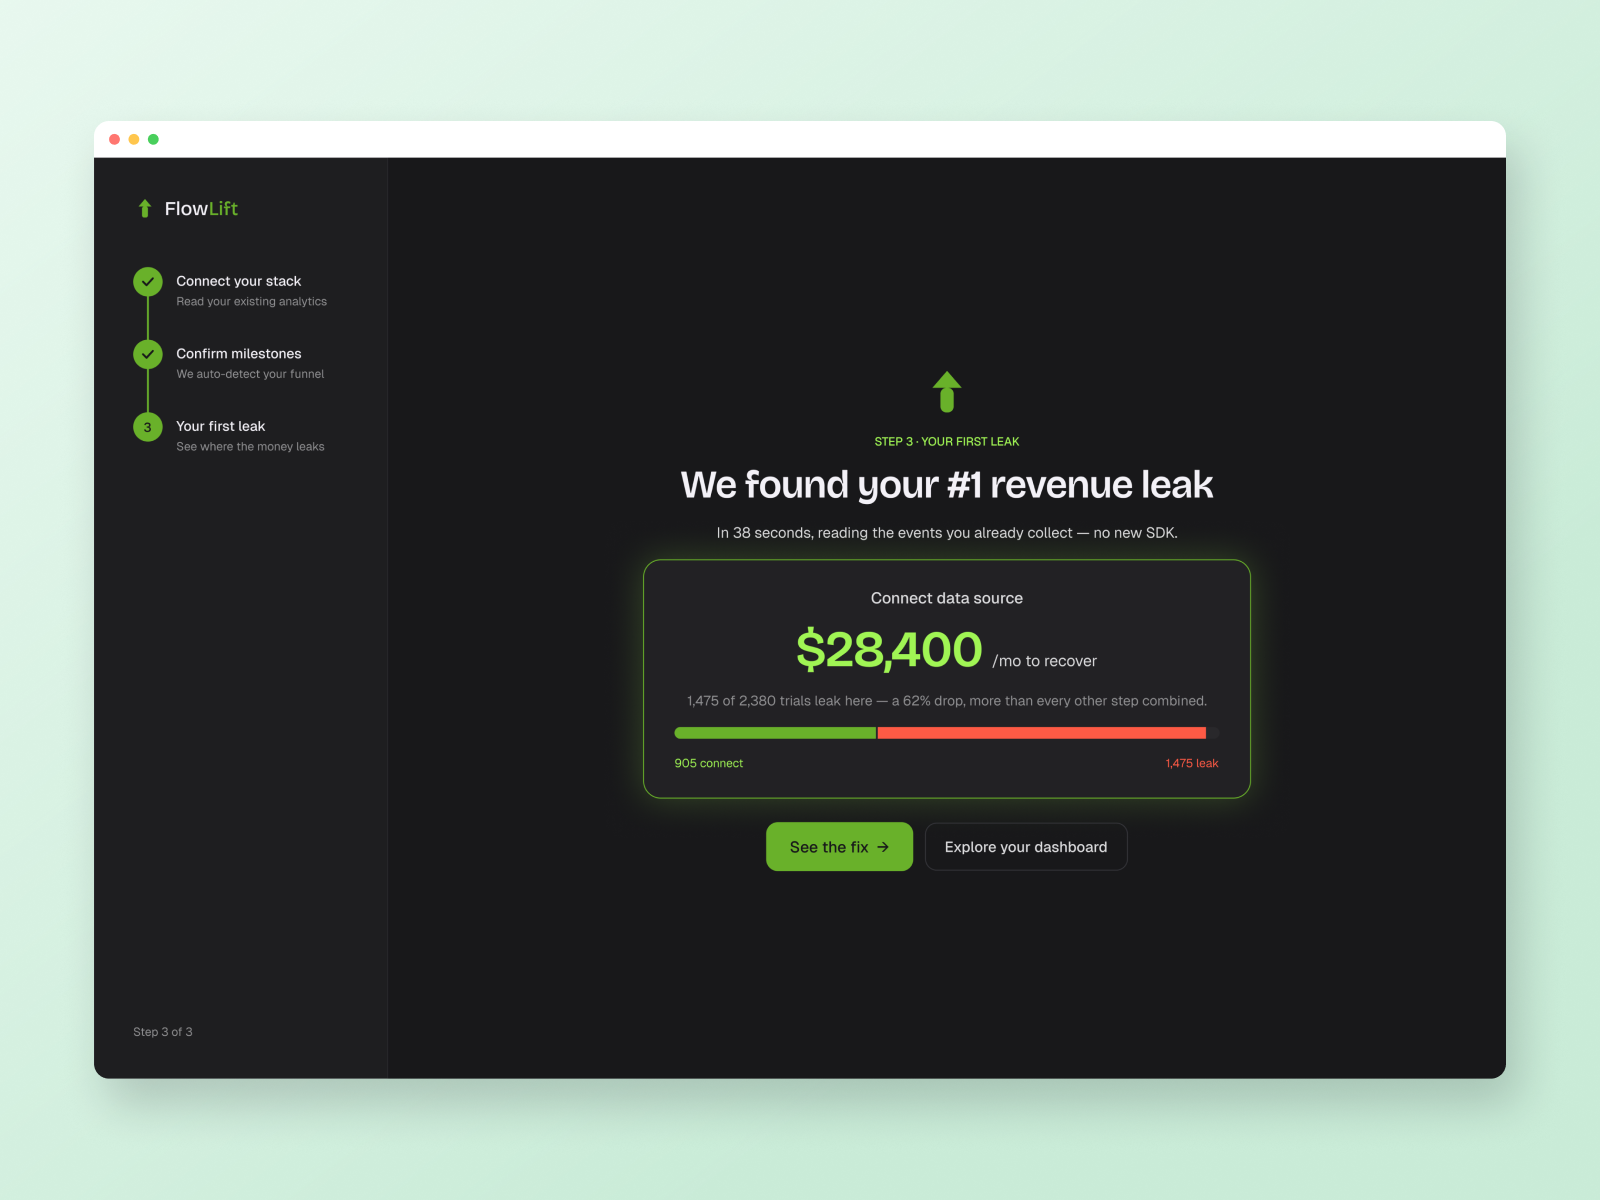
FIG. 09 · ONBOARDING’S PAYOFF
In 38 seconds, reading data the customer already had: the number one leak, in dollars, with the fix one click away. No new SDK, and nothing to configure first.
STATED FLAT
Speed was never the hard part, and this case proves nothing about whether anyone wants the product. Roughly 8.5 screens a day is a real number, every number inside the screens is invented, and stays labelled that way.
FlowLift
SEVEN DAYS · NO USERS, SAID TWICE